The Partial Observer by Alex Thomas
Smoke and the Hidden Threat to Public Health
In regard to our scientific response to the pandemic, White House COVID-19 Response Coordinator Ashish Jha has noted that we got the biology right and the social science wrong. As someone who spent three years as part of a consortium of researchers from Bassett Research Institute, Utica University, and my own SUNY Oneonta studying COVID, I can sadly attest to the accuracy of his statement. Our recent bout with smoke from the fires in Canada is a case in point.
When most people think of science, they remember the splayed-out frog from biology class or turning water into beakers of hydrogen and oxygen. These are the building blocks of our world, but our reality is further organized into what scientists call “complex adaptive systems.” All complex systems have roughly similar properties, and understanding them is what unites meteorologists, evolutionary biologists, and sociologists (like me) in a common cause.
Complex systems are composed of individual agents: Think of a single cell in your body or an antelope that is part of a herd. In social systems, each individual agent (a fancy way of saying “person”) has a unique perspective, set of beliefs, biological characteristics, etc. Through interaction with other agents, a logic that governs the system as a whole emerges in a process called, well, emergence. Simply stated, the whole is more than the sum of its parts.
Because complex systems have a seemingly infinite number of interactions among individual agents, they are notoriously difficult to predict. Scientists can understand the process of their evolution, but beyond a certain time frame our ability to account for every variable is limited. This is largely a measurement issue: With current technology, we simply cannot know the position of every atom in the atmosphere, the thought of every person at every point in time, or which new horrifying combination of traits will emerge on the virus that causes COVID-19. Instead, scientists in these fields turn to dynamical system modeling to understand how these systems operate.
For example, in order to understand the COVID outbreak on our campus in fall 2020, Greg Fulkerson and I used a model for understanding disease spread called a SIR model (SIR stands for susceptible, infectious, recovered). Ours was quite simple, but it shows the impact of the campus leaders’ decision to test every student on campus. With no mitigation, our model predicted more than 2,000 cases in a two-week period, each with the potential to start a new outbreak somewhere else. Because university officials chose to test every student on campus, effectively changing the environment in which the virus could spread, the actual number of cases over that same period was 673. Although we have a good knowledge of how the virus spread, the populations dynamics involved with spread, and its interaction with individual behavior, the best we can do is model the spread, and if one of our assumptions is slightly off, the whole model changes.


Fig. 1. Top: A simple SIR model used to understand the dynamics of the SUNY Oneonta outbreak. Above: The effect of testing every student is reflected in the red line representing the actual number of cases, compared to the black line which represents the expected number of cases based on the SIR model. This is called “flattening the cure.”
What does this have to do with smoke and public health? Consider the Air Quality Index. It is based on a compilation of measurements of various pollutants in the atmosphere, but as with any complex system, it is only as good as the data going in.
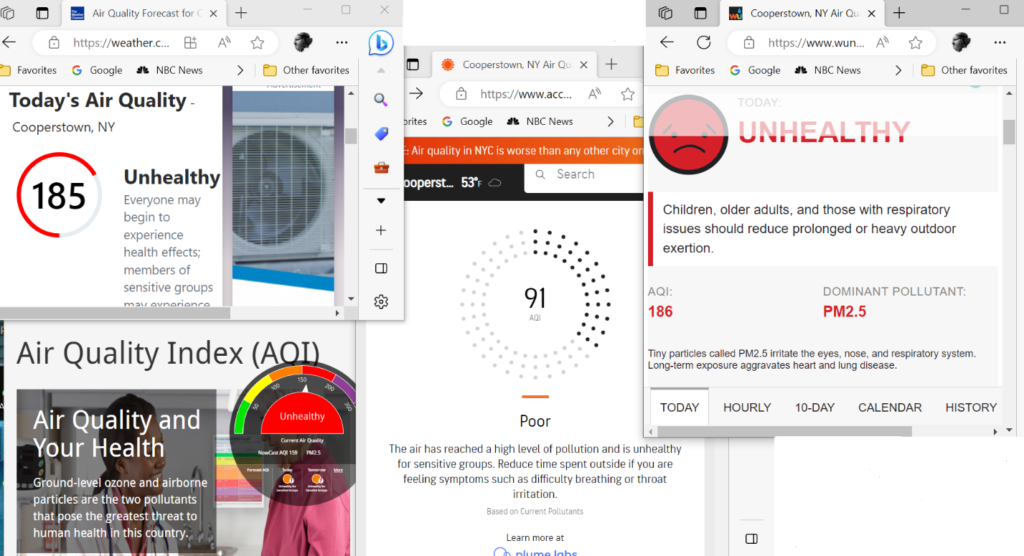
AirNow, the federal government website, has a set of air monitors around the country, the closest one to us being in Utica. They feed the measurements into a computer and use a set of algorithms to model what the AQI is in Cooperstown. For the most part, this is also how private companies calculate the AQI, using a different set of air monitors and algorithms. Unfortunately, each website or app reports the AQI for a specific location, giving the impression that the figure reflects a direct measurement of air quality when it is actually a product of data analytics. As you can see, because each agent has a different set of inputs and algorithms, the values reported can be wildly varied.

Fig. 2. Above: An assortment of conflicting AQI values for Cooperstown at about 5 p.m. on Wednesday, June 7. From left: The Weather Channel, AirNow, AccuWeather, Weather Underground
The direct effect on public health messaging is obvious: The appropriate actions for dealing with air pollution are different when AQI is 91 as opposed to 186, and more accurate information is needed.
There is another, more ominous, threat to health messaging: seeing such variation in reported AQI for the same location at the same time, a member of the public has good reason to question the numbers. If people learn to distrust a seemingly unassailable quantitative measure, it will lead to greater distrust of science and scientists in general. Since public health messaging requires clear messaging about complex scientific issues, this can only complicate matters. It is fair to say that none of these companies want to mislead the public, and given their unique measurement structures and algorithms, they can each have valid results that nevertheless contradict each other.
As with other social phenomena, even if every firm has positive intentions, unclear guidance and a fostering of distrust emerges from the system as people interact with multiple apps. If we want to improve messaging about public health issues, scientists across all disciplines need to better convey the benefits and limitations of what we can and cannot do.
Alex Thomas is professor of sociology and executive director of the PLACES Institute at SUNY Oneonta.

